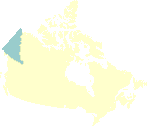
Yukon
| CHMD Data 1950-2016‡ |
Age Interval x Year Interval | |||||
| 1 x 1 | 1 x 5 | 1 x 10 | 5 x 1 | 5 x 5 | 5 x 10 | |
| Births | ||||||
| Deaths () | ||||||
| Population size | ||||||
| Exposure-to-risk | ||||||
| Death rates | ||||||
| Life tables - Male | ||||||
| Life tables - Female | ||||||
| Life tables - Total | ||||||
| Life expectancy at birth | ||||||
‡ Birth and death data are not available for 2017 and later.
WARNING: Due to small numbers, results for this territory may show considerable variation.
NOTE: Due to small annual death counts for this territory, life tables by single calendar year are not computed.

